Balance Sheet User Guide
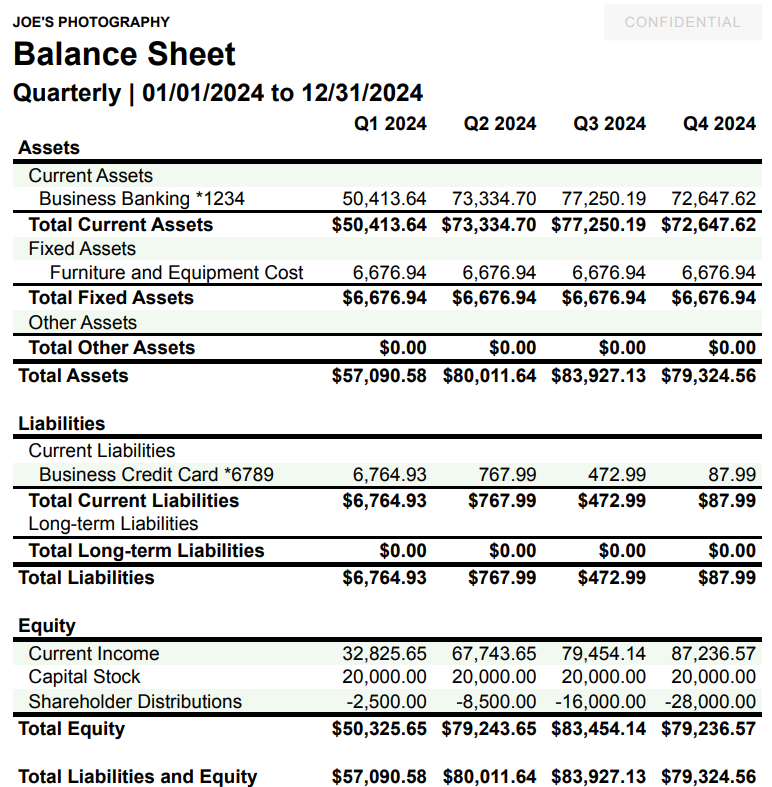
A Balance Sheet is a financial statement that shows a snapshot of a business's assets, liabilities, and equity at a specific moment in time. The Balance Sheet provides insight into the business’s financial health by showing what the business owns and owes, which helps determine the business's ability to pay its obligations
Getting started with the Balance Sheet
The Balance Sheet lists a subset of the General Ledger (GL) accounts, grouped by account type (Asset, Liability, and Equity). This financial statement can be customized to view and compare the account balances at different dates. It can even be drilled down into to see all of the transactions and journal entries contributing to the balance for each specific GL account.
Viewing the Balance Sheet
The Balance Sheet can be viewed directly in Tight's Embedded UI, allowing bookkeepers or business owners to view the GL balances for various periods and drill down into the business's GL accounts.
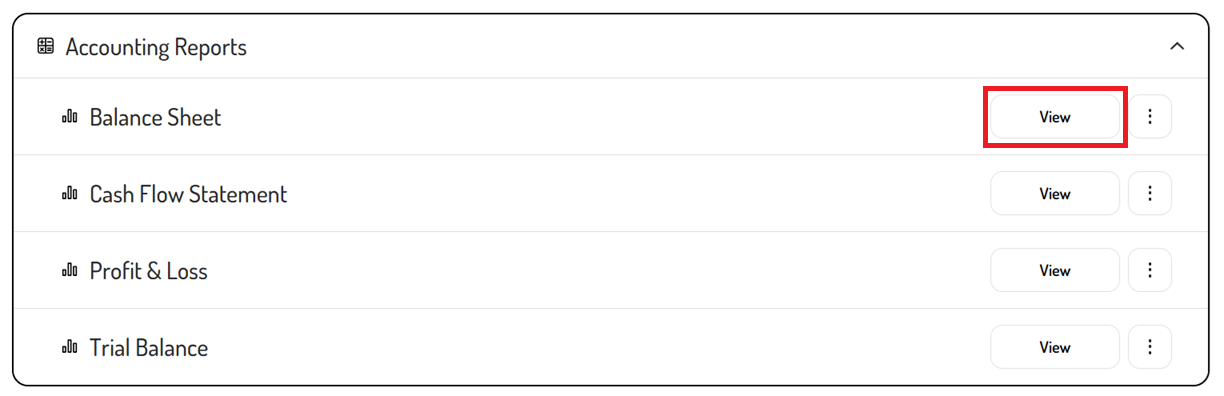
To view the Balance Sheet:
-
Navigate to the Report Dashboard
-
Locate the Balance Sheet
-
Click the 'View' button
Filtering the Balance Sheet
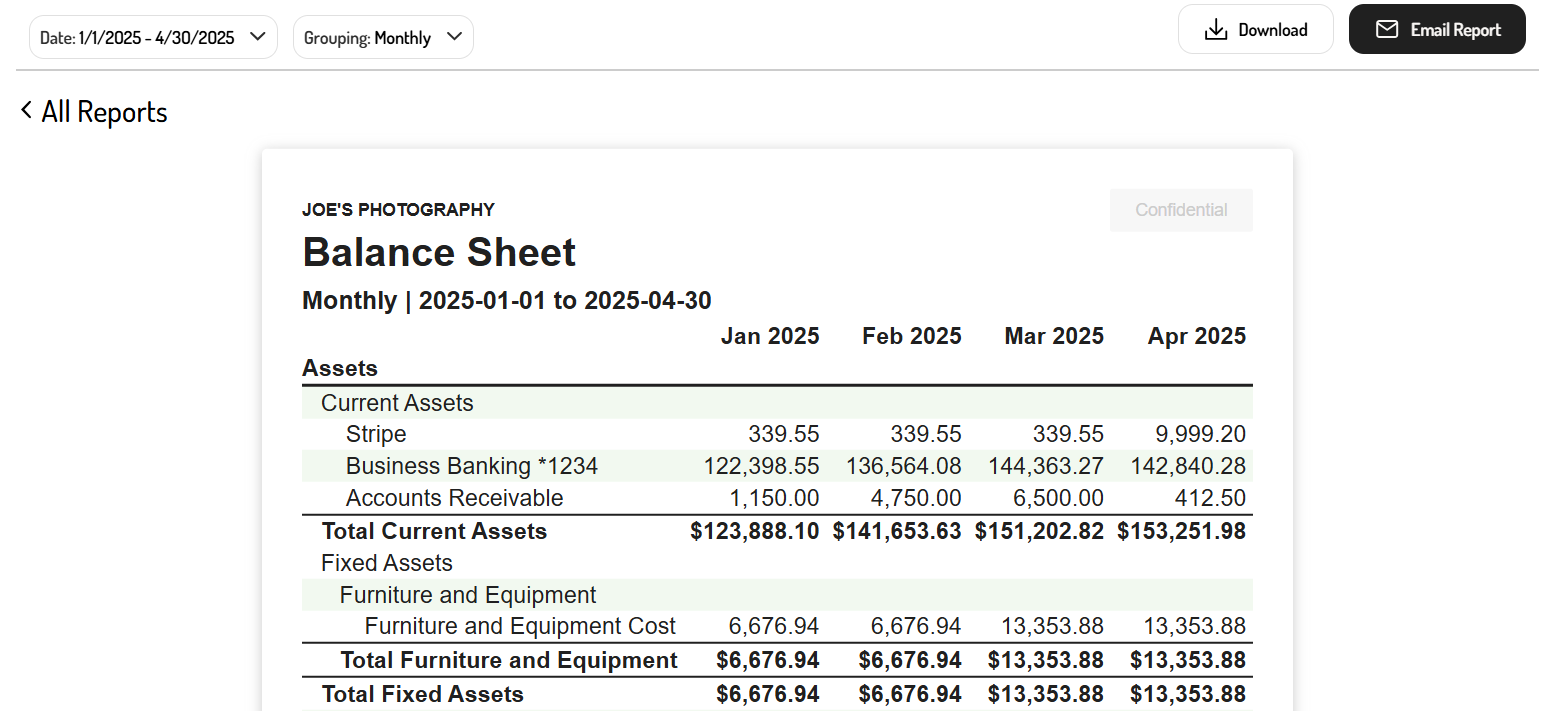
By default, the Balance Sheet will show the data for the current year-to-date, grouped by month. The filters can be used to adjust the timeframe and grouping as needed.
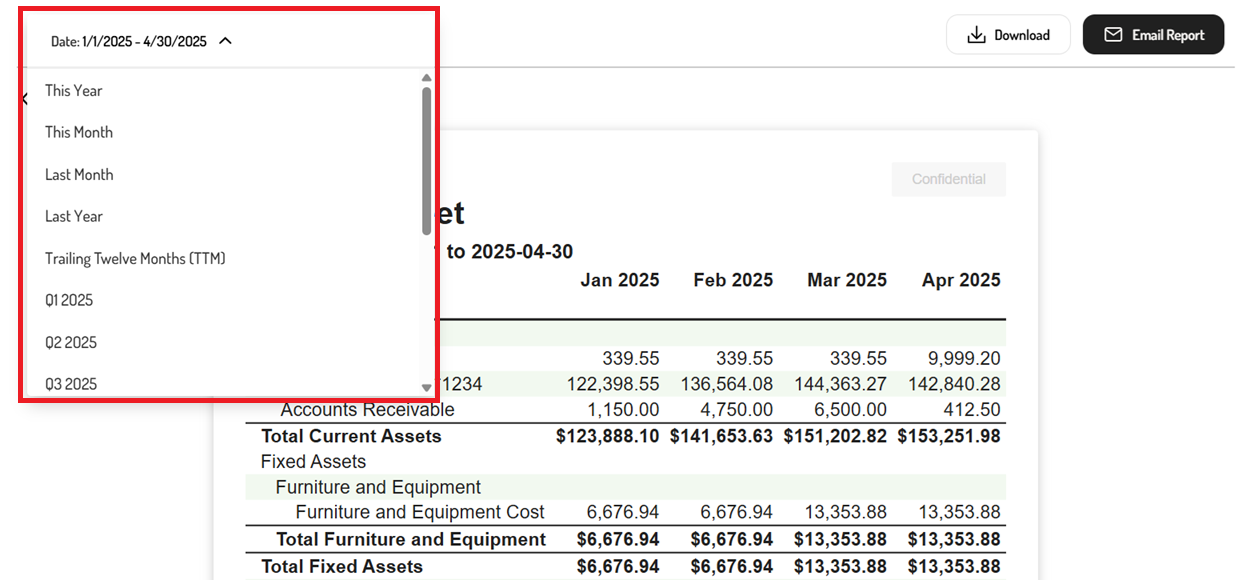
Date filter
By clicking the 'Date' filter, a default timeframe such as 'This Year', 'This Month', 'Last Month', 'Last Year', 'Trailing Twelve Months', or a specific quarter. Alternatively, a custom range can be viewed by setting the start and end date of the report.
The transaction totals in the Balance Sheet will reflect all of the data as of the specified end date since Balance Sheets show a snapshot of the business's assets, liabilities, and equity at a specific moment in time rather than transaction totals for a specific timeframe.
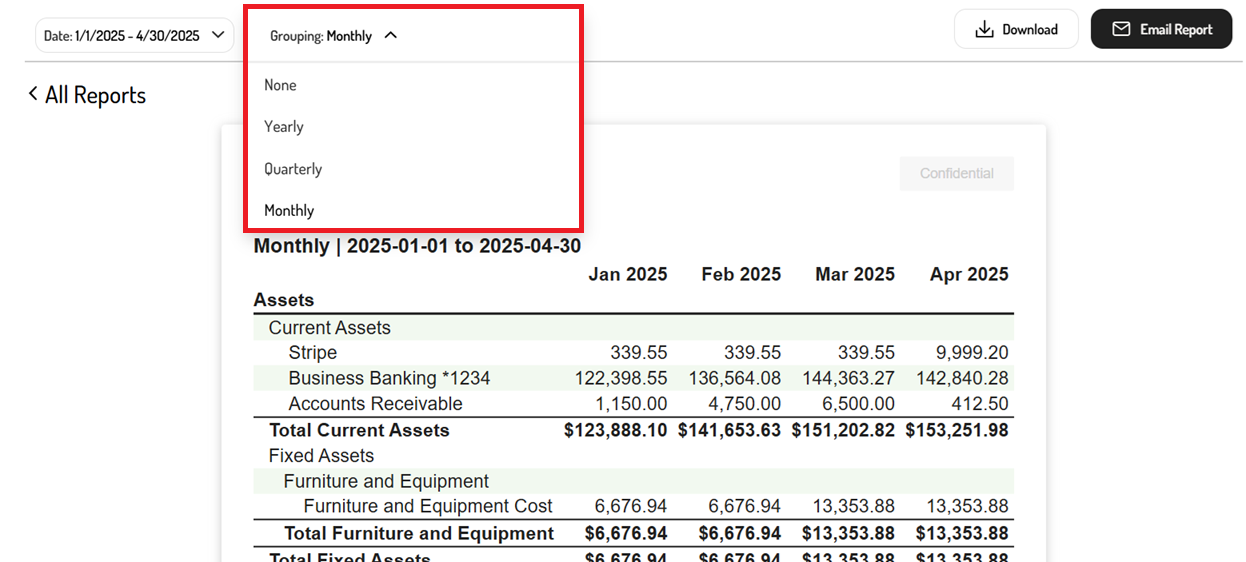
Grouping filter
The 'Grouping' filter allows data to be compared across different periods. Simply select one of the filters to customize the period that is being compared.
These filters include:
- None - No multi-period comparison
- Yearly - Year-over-year comparison for the selected date range
- Quarterly - Quarter-over-quarter comparison for the selected date range
- Monthly - Month-over-month comparison for the selected date range
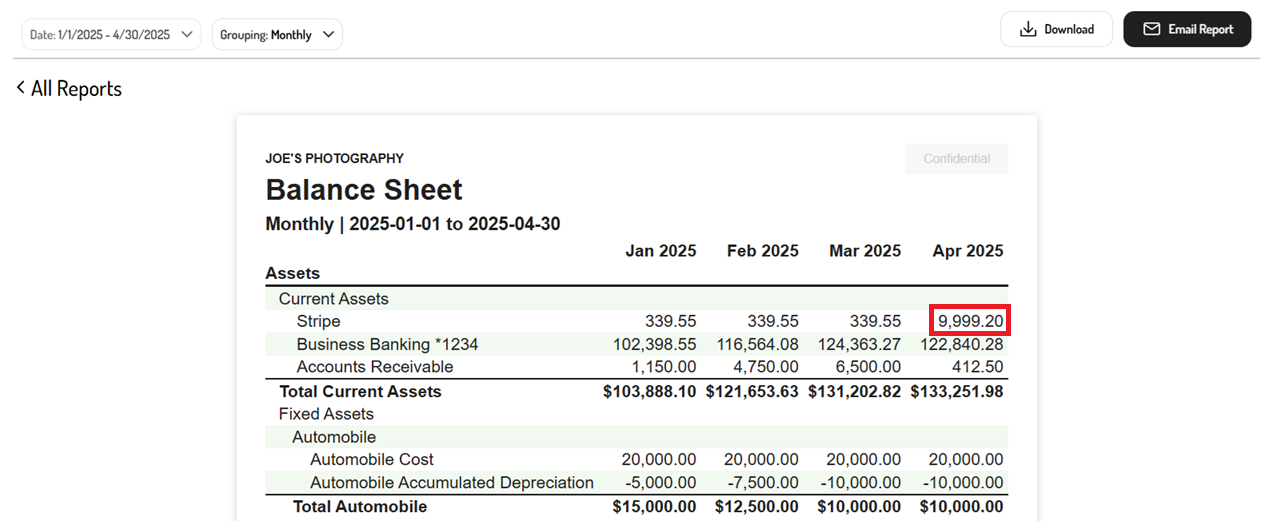
Drilling down into the Balance Sheet
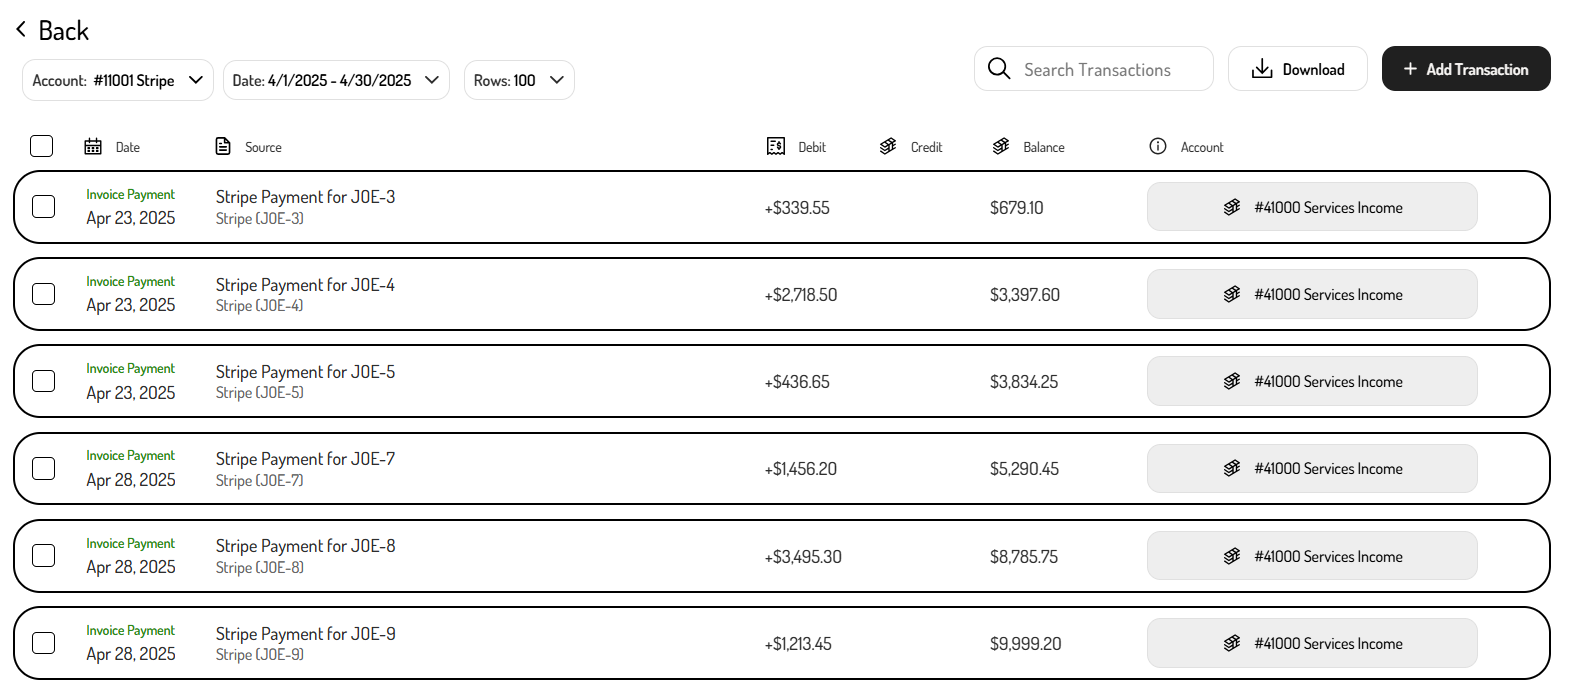
To better understand the transactions and journal entries that contribute to changes in each total on the Balance Sheet, the individual accounts and amounts can be clicked to drill down into the General Ledger.
For example, clicking the Stripe balance for April 2025 will redirect to the General Ledger, filtered to display the Stripe account for the period from 4/1/2025-4/30/2025. There, the transactions and journal entries from April 2025 that contributed to the change in the Stripe balance between March 2025 and April 2025 on the Balance Sheet are listed.
Exporting the Balance Sheet
In addition to viewing the Balance Sheet directly in Tight's Embedded UI, this financial statement can be exported in PDF or spreadsheet format.
To export the P&L:
-
Navigate to the Report Dashboard
-
Click on the Balance Sheet
-
Use the filters to customize the report
- Click the ‘Date’ field to select a default date range or custom date range
- Select the 'Grouping' field to create a comparative report (e.g. monthly, quarterly, yearly)
-
Click ‘Download’ or ‘Email Report’
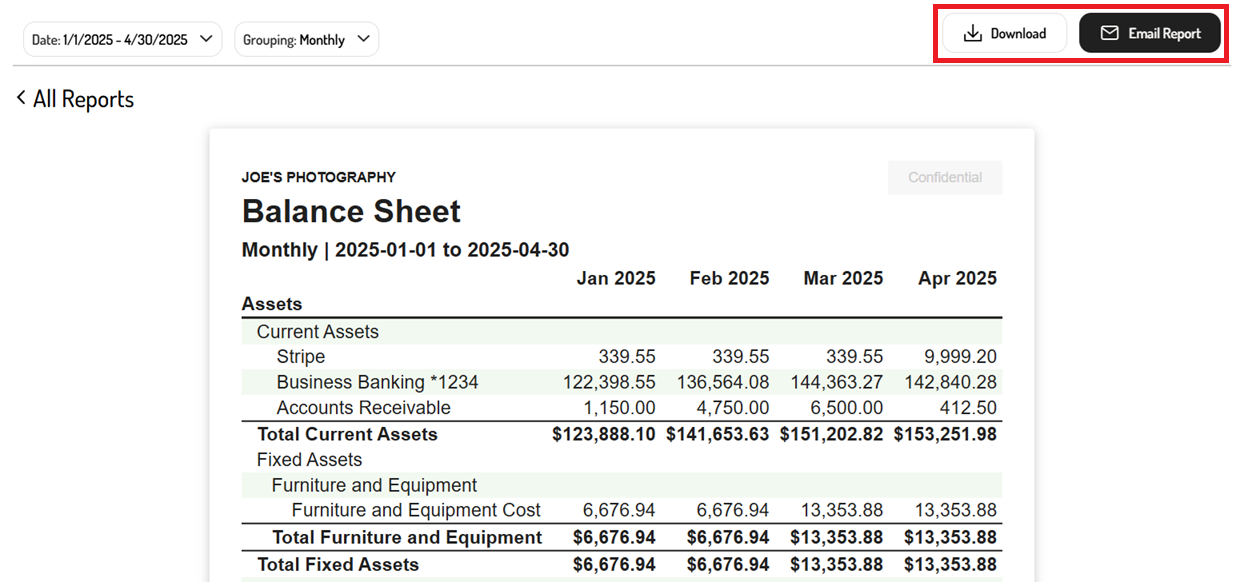
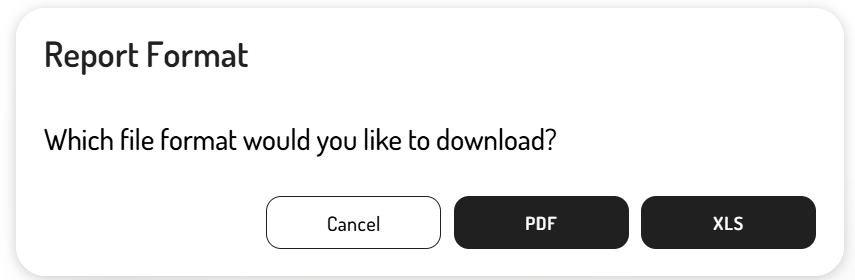
-
Select the report format (i.e. PDF or XLS)
Updated 11 months ago