Profit & Loss User Guide
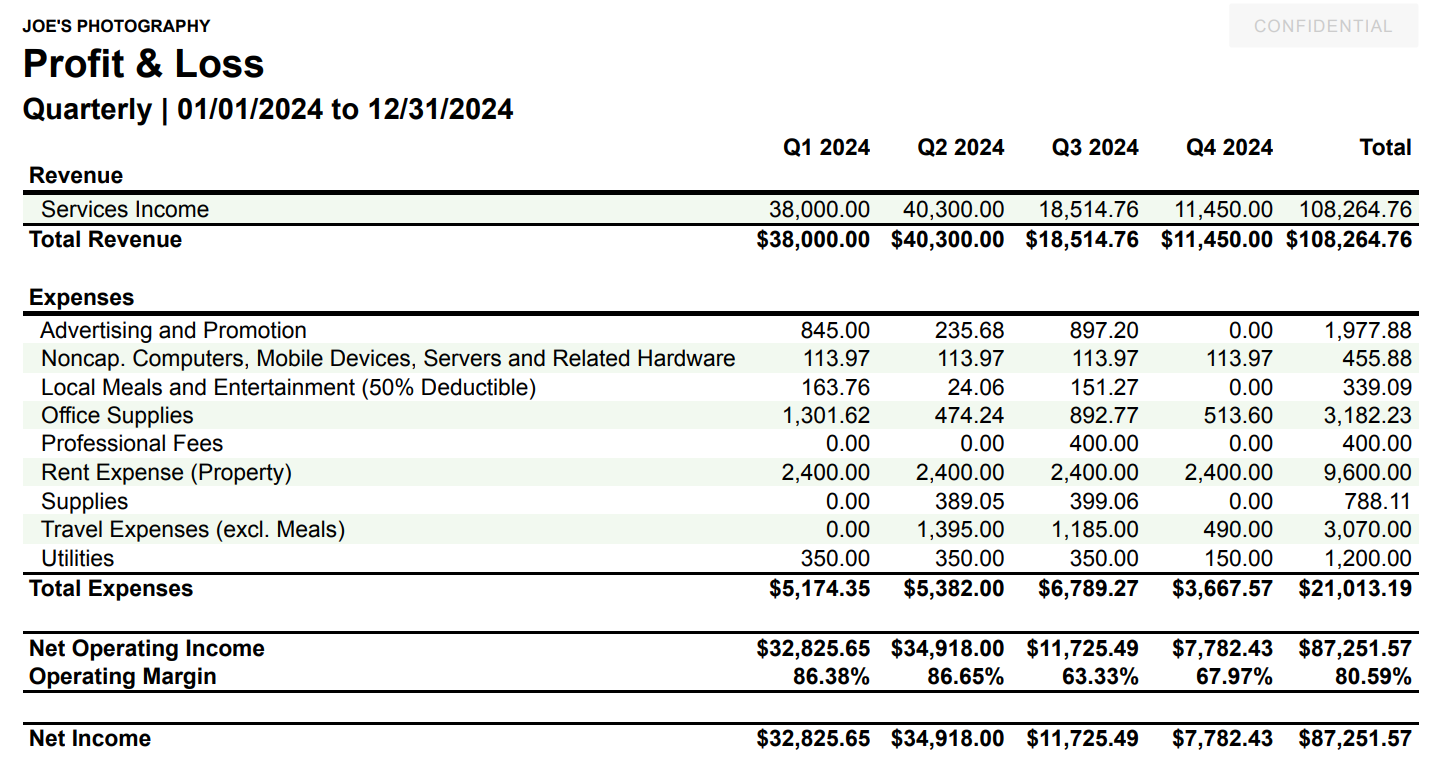
A Profit & Loss (P&L) is a financial statement that summarizes the profitability (or lack thereof) for a business in a specific timeframe. The P&L provides insight into the business’s financial performance by showing the overall profit or overall loss of the business for the specified timeframe, including where money was earned (income) and where money spent (expenses).
Getting started with the Profit & Loss
The P&L reflects the General Ledger (GL) accounts associated with each tracked transaction and journal entry. This financial statement can be customized to view and compare any of the tracked data. It can even be drilled down into to better understand all of the transactions and journal entries making up the total for each specific GL account within the reporting period.
Viewing the Profit & Loss
The P&L can be viewed directly in Tight's Embedded UI, allowing bookkeepers or business owners to filter and drill down into the business's P&L.
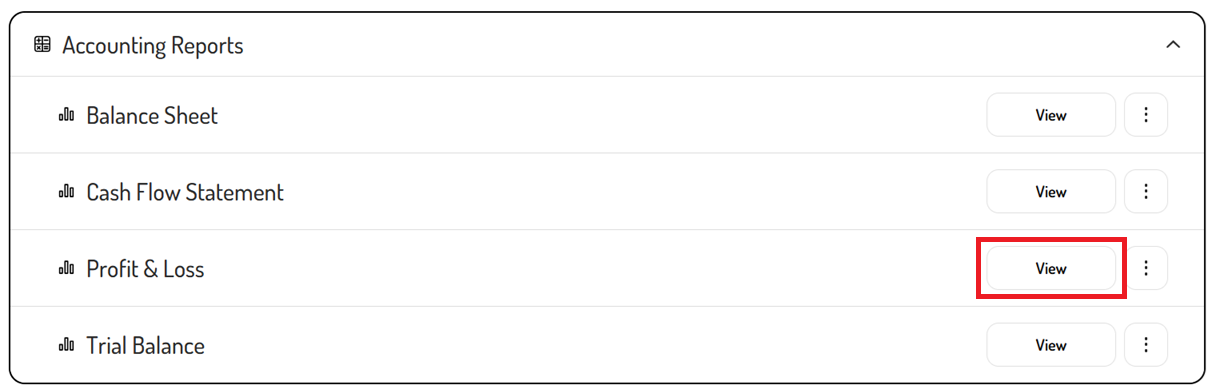
To view the P&L:
- Navigate to the Report Dashboard
- Locate the Profit & Loss
- Click the 'View' button
Filtering the Profit & Loss
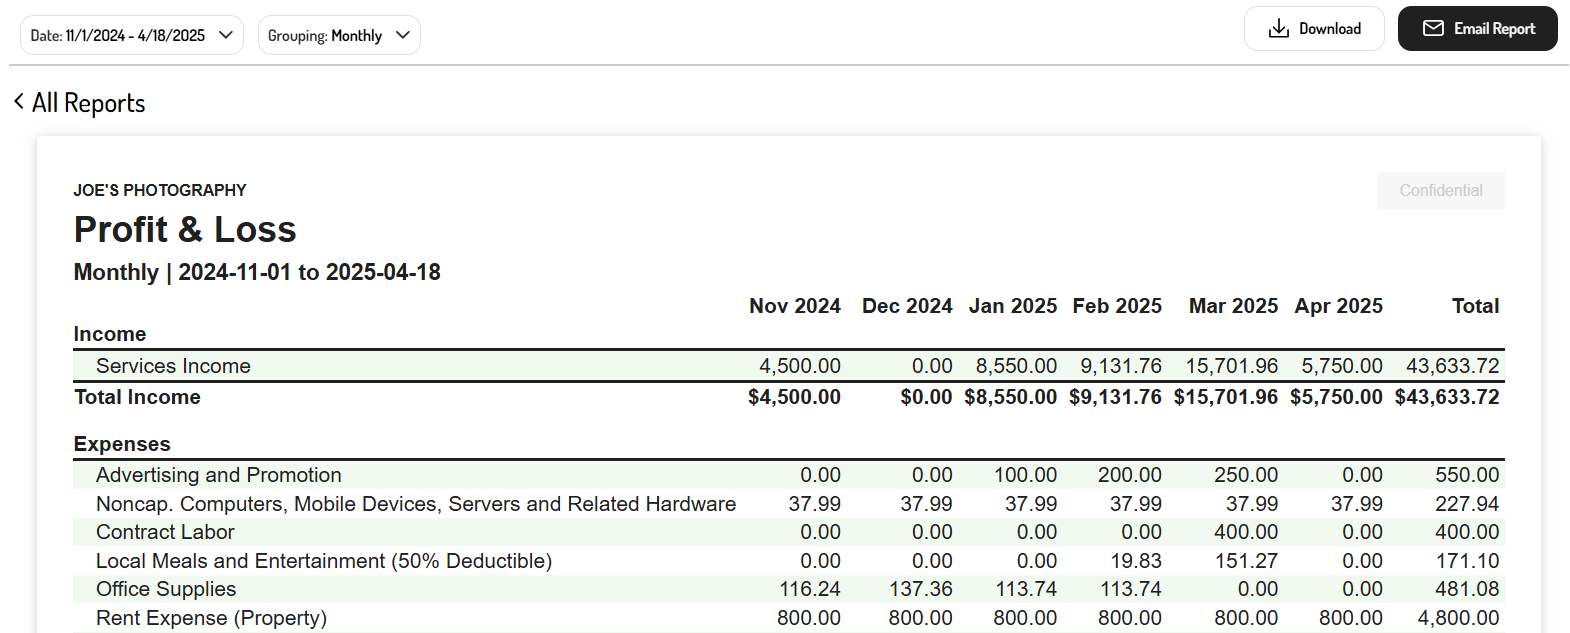
By default, the P&L will display the past 6 months of data, grouped by month. The filters can be used to adjust the timeframe and grouping as needed.
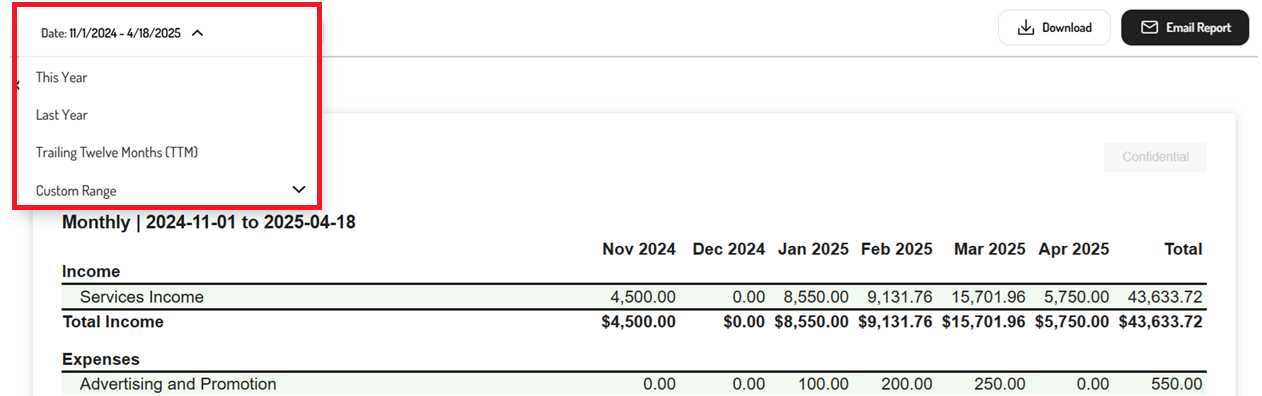
Date filter
By clicking the 'Date' filter, a default timeframe such as 'This Year', 'Last Year', or 'Trailing Twelve Months' can be selected. Alternatively, a custom range can be viewed by setting the start and end date of the report.
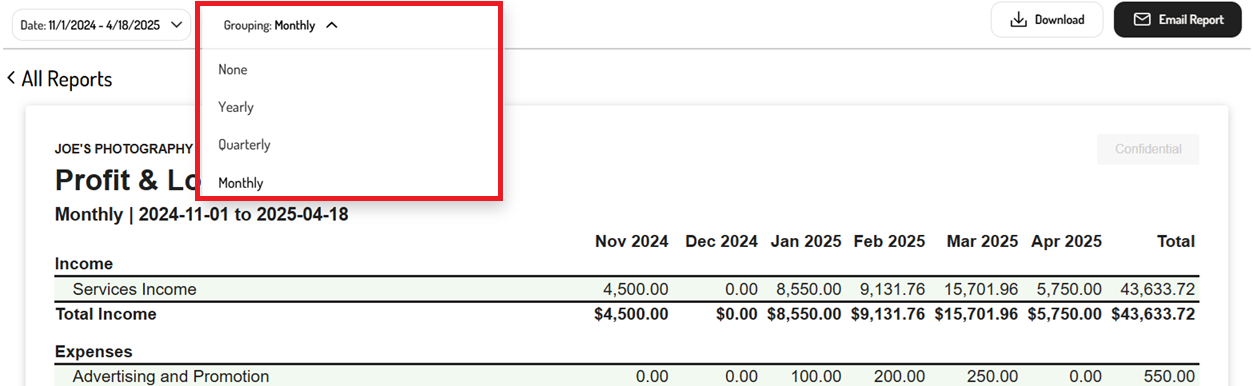
Grouping filter
The 'Grouping' filter allows data to be compared across different periods. Simply select one of the filters to customize the period that is being compared.
These filters include:
- None - No multi-period comparison
- Yearly - Year-over-year comparison for the selected date range
- Quarterly - Quarter-over-quarter comparison for the selected date range
- Monthly - Month-over-month comparison for the selected date range
Drilling down into the Profit & Loss
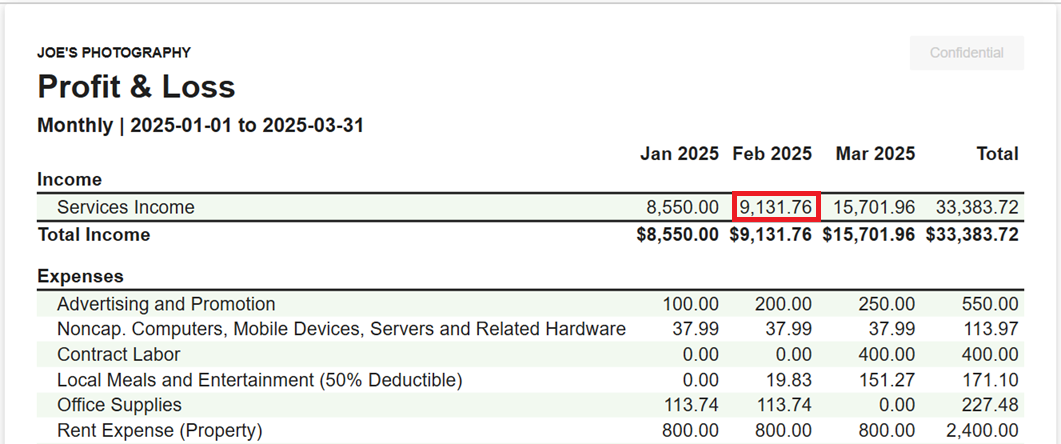
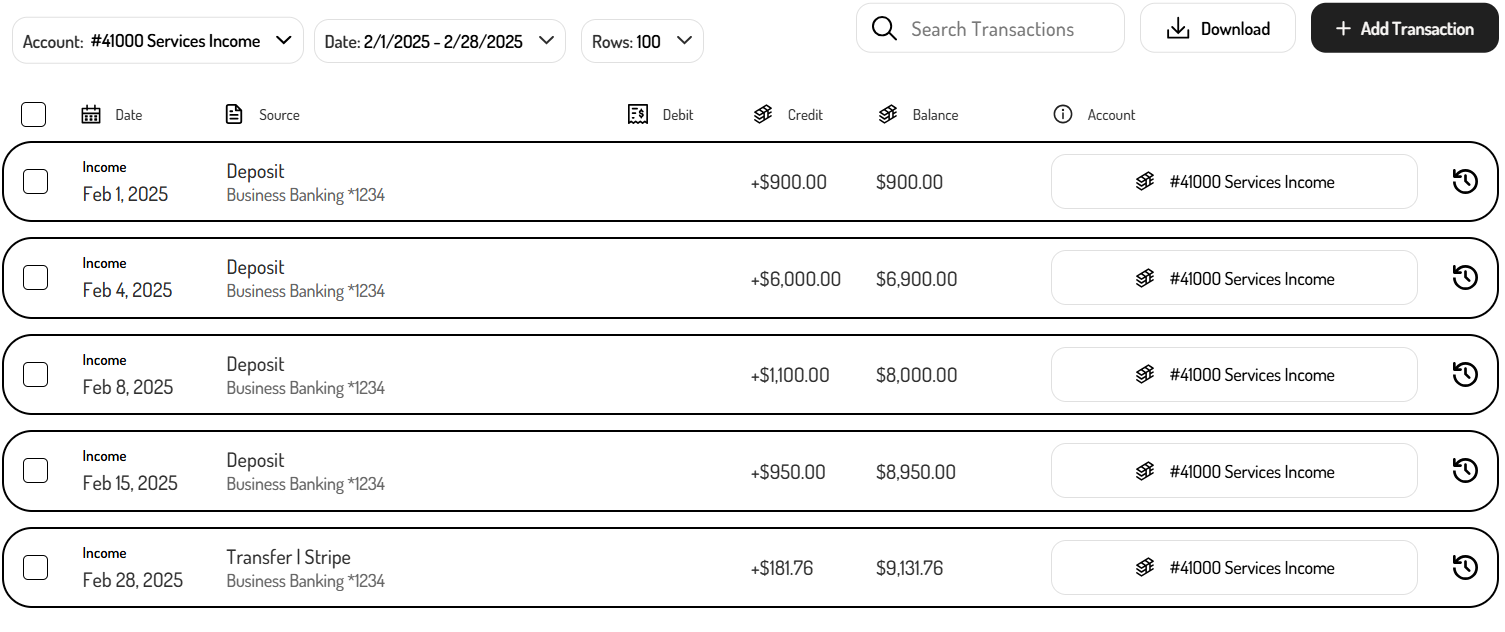
To better understand the transactions and journal entries contributing to each total in the P&L, the individual accounts and amounts can be clicked to drill into the General Ledger.
For example, clicking the Services Income total for February 2025, redirects to the GL filtered to the Services Income account for the period 2/1/2025–2/28/2025, where all transactions and journal entries contributing to the February 2025 Services Income total in the P&L are listed.
Exporting the Profit & Loss
In addition to viewing the P&L directly in Tight's Embedded UI, this financial statement can be exported in PDF or spreadsheet format.
To export the P&L:
-
Navigate to the Report Dashboard
-
Click on the Profit & Loss
-
Use the filters to customize the report
- Click the ‘Date’ field to select a default date range or custom date range
- Select the 'Grouping' field to create a comparative report (e.g. monthly, quarterly, yearly)
-
Click ‘Download’ or ‘Email Report’
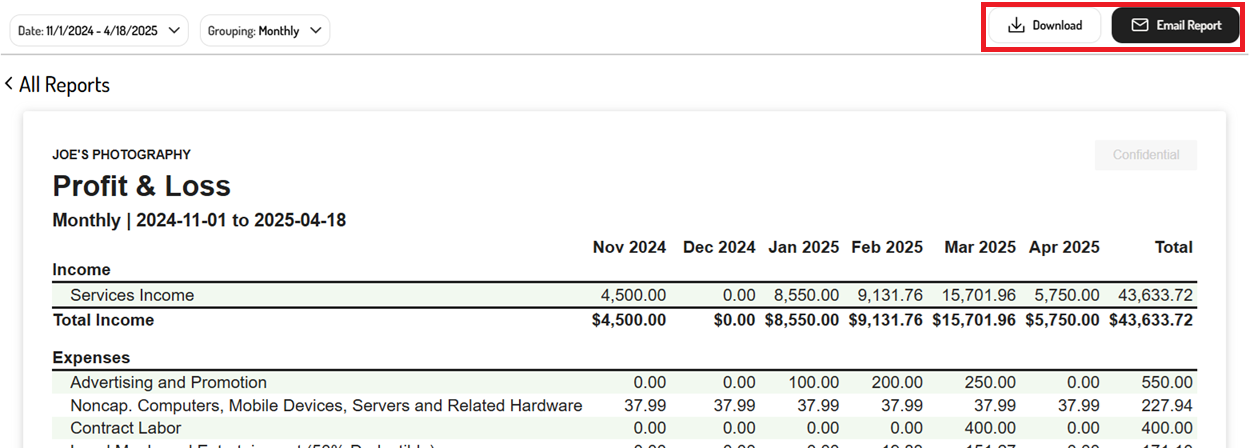
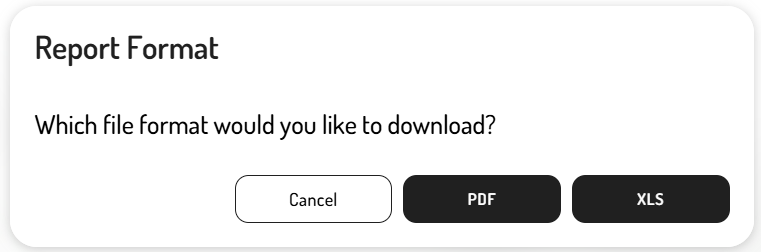
-
Select the report format (i.e. PDF or XLS)
Updated 11 months ago