Cash Flow Statement User Guide
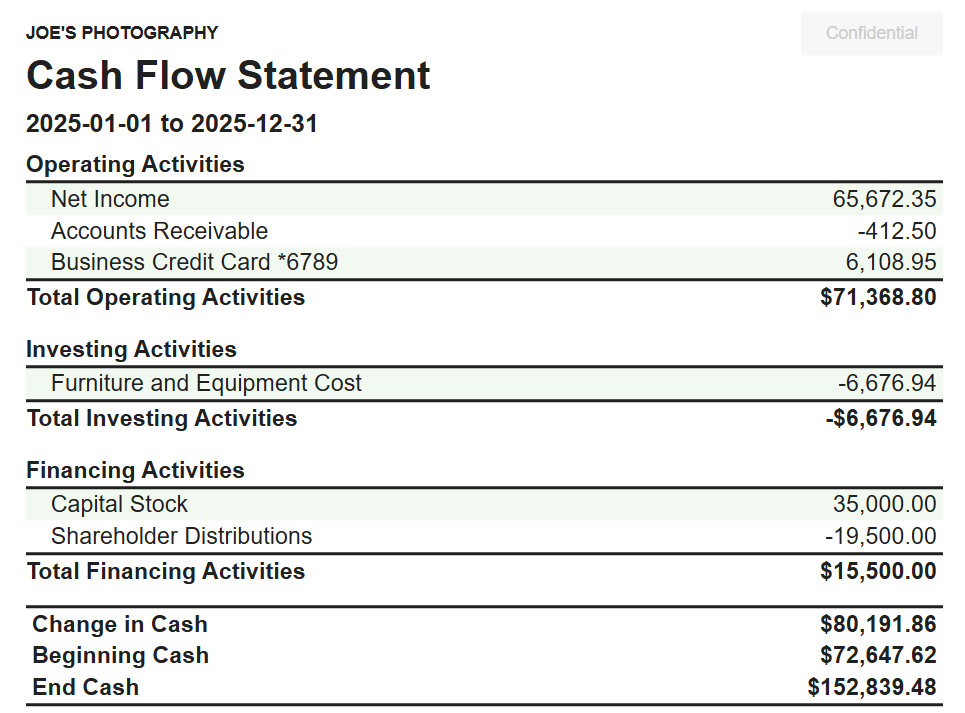
A Cash Flow Statement (aka CFS, Statement of Cash Flows, or SCF) is a financial statement that provides a detailed overview of a business's cash movement during a specific period. The CFS provides insight into the business's operating, investing, and financing activities. This information helps the business understand their cash on hand, which informs their ability to operate in the short-term and long-term as well as their ability to fund business operations.
Getting started with the Cash Flow Statement
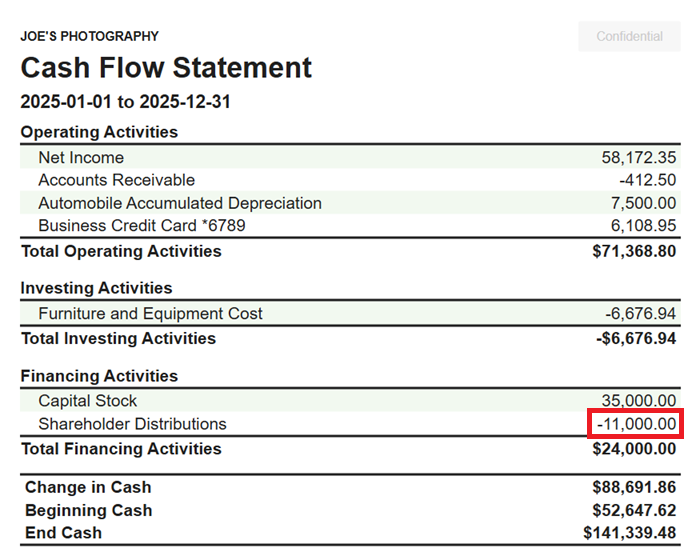
Tight provides an indirect CFS, which is divided into 3 sections:
- Operating Activities - This section includes the business's cash flow from core operations, including income generated and expenses paid
- Investing Activities - This section includes the business's cash flow from selling or purchasing assets
- Financing Activities - This section includes the business's cash flow from equity and debt
The bottom of the CFS summarizes the beginning and ending cash and the resulting cash on hand at the end of the reporting period.
Viewing the Cash Flow Statement
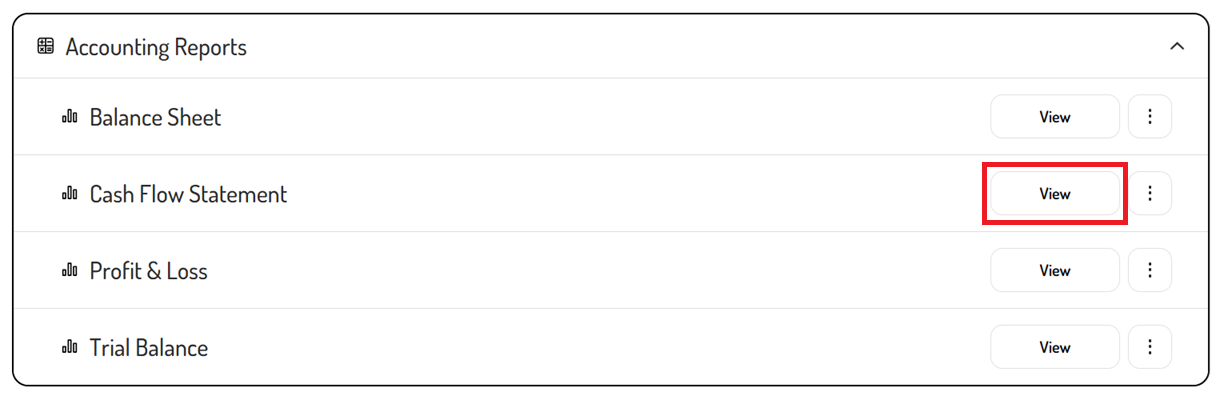
The CFS can be viewed directly in Tight's Embedded UI, allowing bookkeepers or business owners to filter and drill down into the business's CFS.
To view the CFS:
-
Navigate to the Report Dashboard
-
Locate the Cash Flow Statement
-
Click the 'View' button
Filtering the Cash Flow Statement
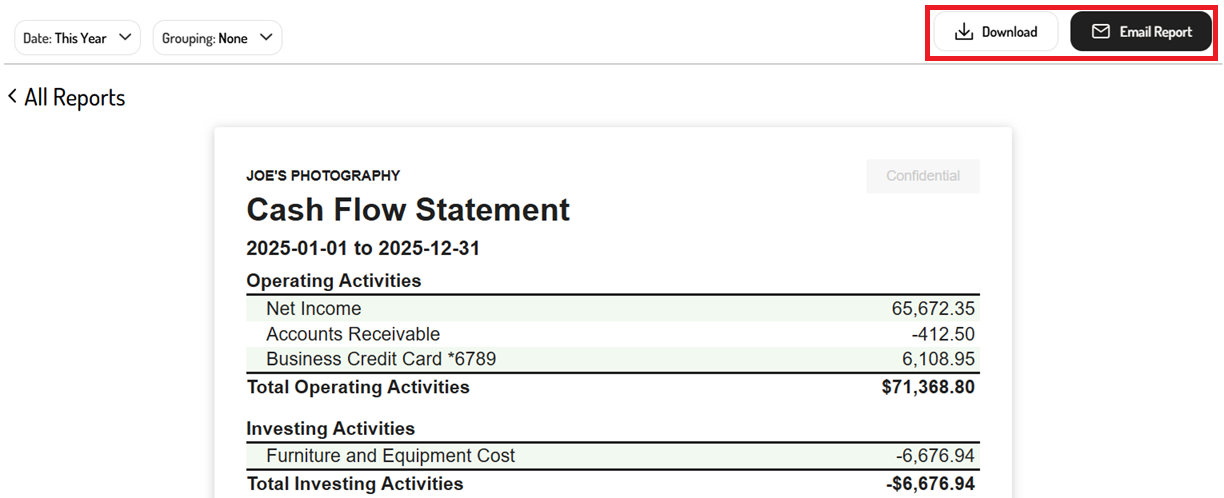
By default, the CFS will display the current year without any grouping. The filters can be used to adjust the timeframe and grouping as needed.
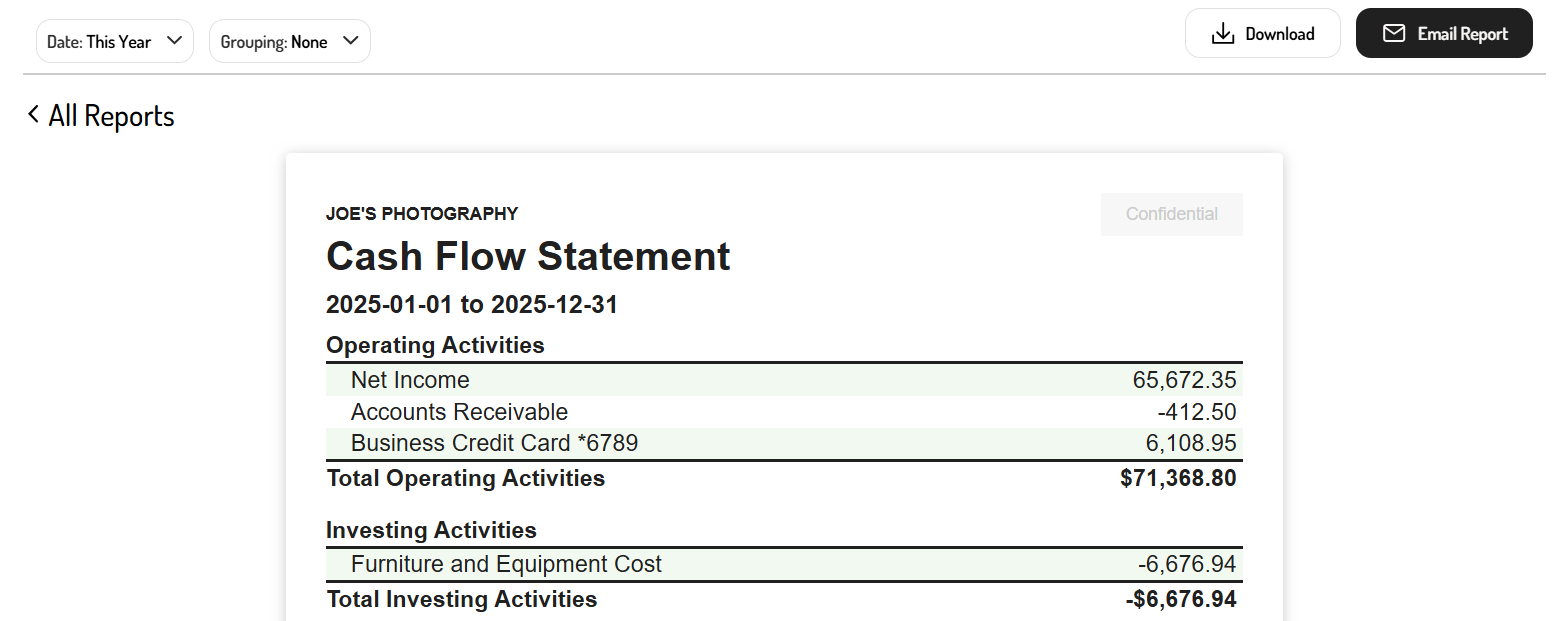
Date filter
By clicking the 'Date' filter, a default timeframe such as 'This Year', 'This Month', 'Last Month', 'Last Year', or a specific quarter. Alternatively, a custom range can be viewed by setting the start and end date of the report.

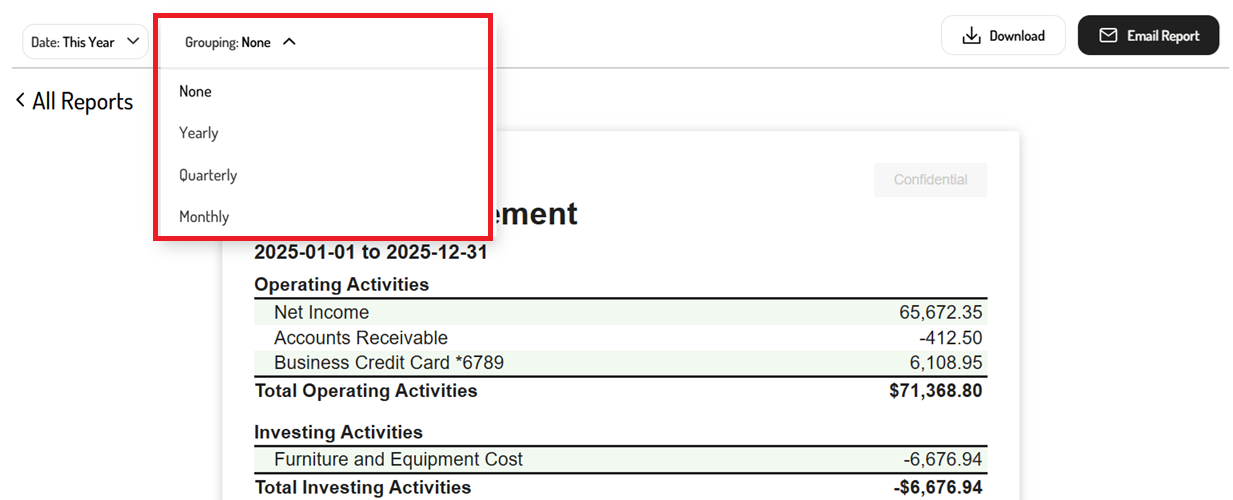
Grouping filter
The 'Grouping' filter allows data to be compared across different periods. Simply select one of the filters to customize the period that is being compared.
These filters include:
-
None - No multi-period comparison
-
Yearly - Year-over-year comparison for the selected date range
-
Quarterly - Quarter-over-quarter comparison for the selected date range
-
Monthly - Month-over-month comparison for the selected date range
Drilling down into the Cash Flow Statement
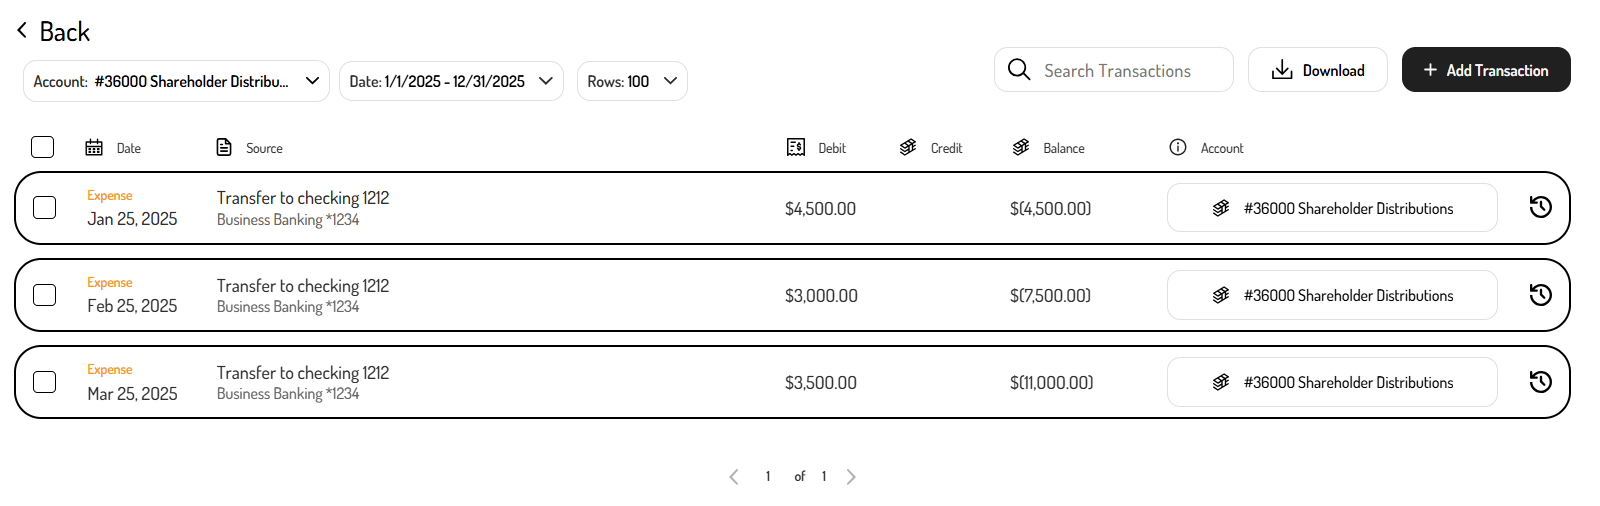
To better understand the transactions and journal entries contributing to each total in the CFS, the individual accounts and amounts can be clicked to drill into the General Ledger.
For example, clicking on the amount for Shareholder Distributions redirects to the General Ledger, filtered to the Shareholder Distributions account, where it displays the transactions and journal entries contributing to the Shareholder Distributions total in the CFS.
Exporting the Cash Flow Statement
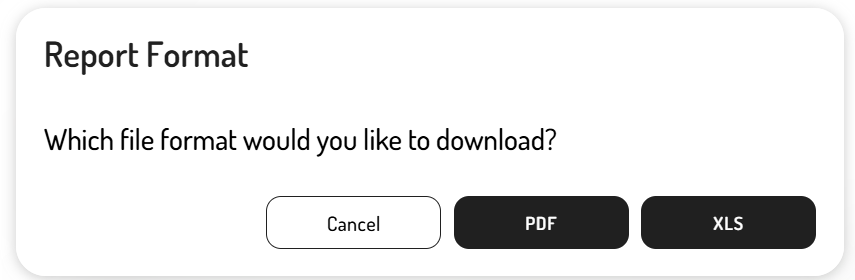
In addition to viewing the CFS directly in Tight's Embedded UI, this financial statement can be exported in PDF or spreadsheet format.
To export the CFS:
-
Navigate to the Report Dashboard
-
Click on the Cash Flow Statement
-
Use the filters to customize the report
- Click the ‘Date’ field to select a default date range or custom date range
- Select the 'Grouping' field to create a comparative report (e.g. monthly, quarterly, yearly)
-
Click ‘Download’ or ‘Email Report’
-
Select the report format (i.e. PDF or XLS)
Updated 11 months ago